Design, Develop, Create

Showing posts with label sketch. Show all posts

Wednesday, 16 November 2022

Exercise: Experiment with a research method

Exercise: Experiment with a research method

Materials:
Copies of the research method protocol template. Use the template to structure your experiment with one or more of the research protocols based on the cards from IDEO.

Choose at least one protocol, but even better if you try more than one, if you have the interest or time available.
Context:
Identify an object or context for field work. Possible examples include:
  • Stairs
  • Doorways
  • Queuing in a cafĂ©
  • Anywhere with a queue
  • Parcel drop services
  • Anything with a touchscreen
  • UCD directional maps online and on-campus
  • Dublin Bus website 
  • ATM machine 
  • Train/LUAs ticketing 
  • Supermarket Self-service checkout machines 
  • Copier machines at the Copi-Print system 
  • UCard Top-up 
  • Printer
  • Kindle or other E-reader 
  • Brightspace (from student’s perspective) 
  • Alarm System 
  • Airport Self-service Checkin 
  • Tesco’s Online Shopping website 
  • UCD Library catalogue 
Time:
Schedule field study observations over several days.

Instructions:
  1. Write your name and the research context on the form
  2. Investigate and propose your own version of the procedure for the research method assigned to you. Base this procedure on readings or your own creative extrapolation of the description on the IDEO methods card.
  3. Conduct a trial run of the procedure on yourself first, then involve another willing participant, and another...
  4. Make hand-written notes, photos and recordings for later analysis.
  5. Keep a record of evidence gathered.
  6. Make an archive of data/records (paper sketches and notes, digital folder, website).
  7. Present your findings and analysis at the next class.

Evaluation:
In class discussion of findings. 
Questions to ask:
1. Did you write the method protocol (recipe/steps)?
2. Did you identify a method reference (source literature/inspiration)?
3. Have provided a sample/example of data you gathered?
4. Did you try to analyse or interpret the data? (may need to apply some tool or technique)
5. What was learnt from it all? Did I learn anything? Can you decide if the method is feasible, practical, suitable for your project?

Research Protocols

Names and descriptions for the IDEO Method Cards (IDEO, 2003)
Ideo (2003) IDEO Method Cards: 51 Ways to Inspire Design. William Stout.

LEARN

Research MethodDescription
Activity AnalysisA description of project relevant dynamics: actions, interactions, tasks, and objects of achieving goals.
Affinity DiagramsRepresent or diagram clustering of design elements with activities, goals, obstacles. Proximity, dependence and relationships
Anthropometric AnalysisHuman factors or ergonomics to assess project relevant use factors.
Character ProfilesPersonas. Archetypes of real people with real goals, lifestyle, behaviour, identities.
Cognitive Task AnalysisList, summary of all available sensory inputs decision points and actions.
Competitive Product SurveyCollect, compare, and conduct evaluations of extant and competitive products.
Cross-Cultural ComparisonsPersonal accounts of differences in situations, behaviour and artefacts in different national or cultural settings.
Error AnalysisCapturing the things that actually go wrong in the project relevant setting.
Flow AnalysisThe flow of information in existing and/or new system.
Historical AnalysisIdentify trends and cycles of product use, customer behaviour, market, and practice. Relate to timeless goals
Long-Range ForecastsNarratives of future scenarios complete with social and technological trends to predict behaviours.
Secondary ResearchSummary analysis of existing sources and 3rd party data on project relevant areas.

LOOK

Research MethodDescription
A Day in the LifeCatalogue a person’s whole day without necessarily focusing on project relevant aspects.
Behavioural ArchaeologyLook at use, wear, the detailed arrangement or organisation of use objects in their use setting.
Behavioural MappingMap position, movement, and use of space over time.
Fly on the WallObserve in context without interfering.
Guided ToursAsk the user to guide you through project relevant spaces and activities.
Personal InventoryAsk the user to reflect on and describe the things they view as important or significant
Rapid EthnographyParticipate and experience it first-hand with the user for as long as possible.
ShadowingTag-along with people through the day.
Social Network MappingNotice the relationships between people, groups. Look for identity, profession, culture, and connections.
Still Photo SurveyBuild up a visual record of key use and interaction moments over time.
Time-Lapse VideoA way of summarising activity over time, use of time, space, and location.

ASK

Research MethodDescription
Camera JournalA written and visual diary of project relevant circumstances and activities.
Card SortOrganise cards spatially in ways that make sense. To expose mental models of device or system.
Cognitive MapsCreate a map of an existing or virtual space. The pathways they know and navigate, mental models.
CollageSelf created collage of arranged images. Used to help verbalise complex or unvocalised themes.
Conceptual LandscapeSketch and juxtapose social and behavioural constructs from participants. People’s mental model.
Cultural ProbesA visual journal for participants to build up themselves. A self generated reflection. Gathered and compared across many participants.
Draw the ExperienceAsk participants to visualise and draw the experience in their own way, with their own associations, order, relationships, theories.
Extreme User InterviewsEvaluate (ask) users at extreme ends of market (early adopters, power users, beginners) to highlight their issues.
Five Whys?Ask “why?” in response to five consecutive answers. Expose/uncover deeper attitudes perceptions.
Foreign CorrespondentsElicit inputs from others (snowball sample) to build up varied cultural and environmental contexts.
NarrationUsers perform tasks and achieve goals while describing aloud. Talk aloud protocol. Stream of consciousness.
Surveys & QuestionnairesTargeted questions to assess design, usage, interaction characterises and perceptions of users.
Unfocus GroupGather a range of tools or materials and get diverse user group to create things relevant to the design or project.
Word-Concept AssociationUsers associate words with design. Cluster user perceptions to evaluate design features & concepts. Value and priority.

TRY

Research MethodDescription
Behaviour SamplingSnapshot people’s activities at different times. How do pervasive products intrude in your lives?
Be Your CustomerWhat is it like to purchase your product? Actual experience of searching, buying, consuming, disposing.
BodystormingAct out scenarios with many people, using space, place, sequence, queues, etc. Test performance in context.
Empathy ToolsExperience the range of users capability for involvement under real conditions.
Experience PrototypeMock up a rough but workable prototype to simulate the experience of using the new product.
InformanceAct out scenarios observed in the field to interpret and analyse in the lab. Builds shared understanding and good for solution formation.
Paper PrototypingRapid paper based mock-ups that are manipulated to demonstrate functionality. To articulate design concepts with users.
Predict Next Year’s HeadlinesInvolve users in future design possibilities. Futuristic, wishing, unmet needs. Help separate what is needed now from what can wait.
Quick-and-Dirty PrototypingAssemble a very rough mock-up of a new feature or product to help start and refine a design.
Role-PlayingIdentify actors/stakeholders involved in design use, enact real activities in real or imagined context.
Scale ModellingSimulation technique to test arrangements of space, place, context.
ScenariosA character-rich story, to communicate (simulate) and test a plausible story in probable context.
Scenario TestingShow depictions of possible future scenarios. Share reactions, refine concepts.
Try it YourselfLike Microsoft’s famous ‘eating our own dog food’ being the first user.

Thursday, 6 October 2022

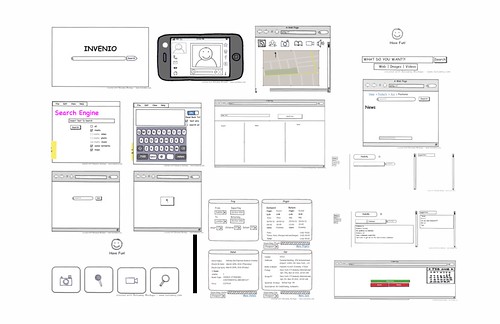
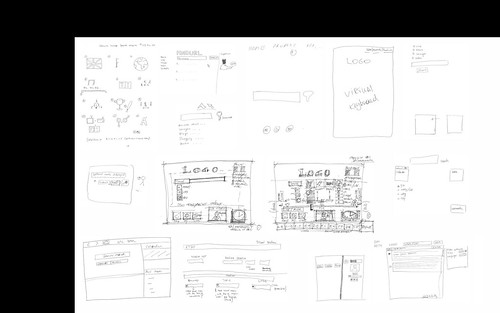
Exercise: (b) Design a text-free search interface

Some hand-drawn ideas and doodles...

The goal of this exercise is to familiarise students with interface design approaches and tools. First by using pencil/pen and paper. Second by using the Balsamiq wire-frame tool to mock-up your design.

Objective
To practice creating design artifacts to display and test technology use/interaction ideas.

Material
A4 paper, pencil or pen.
Create an account on Balsamiq Cloud (no payment details are needed).
Log In to Balsamiq Cloud
https://balsamiq.cloud/#login

Instructions
1. Use paper/pencil sketch a mockup of a new kind of Internet ‘search page’ that doesn’t use text (at all)! (allocate 10")
2. Collect the sketches and display them to the class; allow the group to provide a brief commentary. (allocate 10" to display all mockups).
3. Next, use Balsamiq to create a digital version of the design. The new design may vary from the paper/pencil sketch. (allocate 15")
4. Discuss the following reflection points. (allocate 10")

Reflection
How did the quality and level of design discussion differ from the earlier exercise?
Comment on how you conceptualised or simulated the 'user' of your design.

References
Snyder, C. (2003) Paper Prototyping: The fast and easy way to design and refine user interfaces, San Francisco, CA, Morgan Kaufmann, Elsevier Science.


(other tools include: wireframe.ccapp.moqups.cominvisionapp.comsketchapp.comAxureJustinmindMarvelapp/POPapp and iRise)


Previous Student Examples

Dilyan's example: Fast booking mock up: Fast booking mock up

Whole class examples in collage:
designdiagrams02

Thursday, 3 October 2019

Exercise: (a) Design your ideal search page

This exercise familiarises students with interface design approaches and tools. The exercise is inspired by Carol Snyder's book titled "Paper Prototyping" (2003).

Objective
To practice creating design artifacts to display and test technology use/interaction ideas.

Material
Sheets of A4 paper, post-it notes, pens and pencils of different colours.

Instructions
1. In groups of 2 or 3 use paper/pencil sketch a mockup of a basic Internet ‘search page’. (allocate 10")
2. Collect the sketches and display them to the class; allow the group to provide a brief commentary. (allocate 10" to display all mockups).
3. In the same groups use Balsamiq to create a digital version of the design. The new design may vary from the paper/pencil sketch. (allocate 15")
4. Discuss the following reflection points (in groups first followed by class discussion). (allocate 10")

Reflection
Describe your feelings and thoughts on the process of translating your ideas into a concrete representation.
Comment on the discussion dynamics within the group.
How did the tool used shape, constrain or enable your design thinking?
Consider the difference between paper/pencil sketch vs Balsamiq.

References
Snyder, C. (2003) Paper Prototyping: The fast and easy way to design and refine user interfaces, San Francisco, CA, Morgan Kaufmann, Elsevier Science.


Student Examples

Whole class examples in collage:
designdiagrams01

Tuesday, 3 September 2019

Exercise: (c) Design for search by smell

(a collaboration with Norman Su) A variation on earlier design exercises (exercise a and exercise b)

Objective
Theory: To demonstrate the design dynamics surrounding paper sketches, digital sketches, and speculate on the implications for digital design environments.
Practice: To gain practice at creating sketches and digital design artifacts to display and test technology use/interaction ideas.

Materials
Sheets of A4 paper, post-it notes, pens and pencils of different colours.
Online access to the Balsamiq Mockups wireframing tool. http://webdemo.balsamiq.com/ (accessed: 2015-05-22. Also see http://balsamiq.com/products/mockups (accessed: 2010-2011)

Instructions Part 1
1. In groups of 2 or 3 use paper/pencil sketch a mockup of a new kind of App that uses 'scent' or 'smells'! (allocate 10")
2. Assume there is some way to capture 'scent' or 'smells'.
3. 10 minutes
4. Let me know (raise your hand, etc.) when you’re done

Instructions Part 2
5. In the same groups use Balsamiq to create a digital version of the design. The new design may vary from the paper/pencil sketch.
Tips:
Mockup → Download as PDF (to save a copy of your finished design)
Mockup → Clear Mockup (but don't mistakenly wipe your mockup before you save a copy)
6. 15 minutes
7. Let me know (raise your hand, etc.) when you’re done
8. Discuss the following reflection points (in groups first followed by class discussion). (allocate 5")

Reflection
Your own thoughts/observations?
How many design possibilities were sketched on paper? In Balsamiq?
Consider the difference between paper/pencil sketch vs Balsamiq.
How did the tool used shape, constrain or enable your design thinking?
Comment on the discussion dynamics within the group.
Did someone take responsibility for driving the group forward?
Describe your feelings and thoughts on the process of translating your ideas into different concrete representations.
Can you identify 'who contributed what' to the designs?

References
Digital nose teaches machines to smell - Turck duotec acquires a stake in SmartNanotubes Technologies (link)
The science of smell (link to article on brainfacts.org)
Intel Neuromorphic chip demonstrates smell functionality (article from intel.com)
"Sniffing Entrapped Humans with Sensor Arrays" (link) & NewAtlas article (link)Chat Perf for smartphone. Intro article on Gizmag (link)
SAPER app (link on gizmag). Not quite an electronic nose but close.
Wongchoosuk et al, (2009) Detection and Classification of Human Body Odor Using an Electronic Nose. Sensors, 9, 7234-7249. (doi 10.3390/s90907234 - resolve via dx.doi.org)
How Internet Odors Will Work (howstuffworks.com)
Related imagery and concepts on the Edible Geography blog (ediblegeography.com)
Want the nose of a Sommelier? (Null, 2018 - article on wired.com)

Sunday, 2 October 2016

Using problem-based cases for self-directed learning

Two posts on the managingglobalsourcing blog that go into the detail to help you analyse and learn through case studies...


Tuesday, 22 September 2015

The Essence of Design: some notes

What is the essence of Design?
Competing on the eight dimensions of quality D. A. Garvin Harvard Business Review 65 101-109 (1997)
In Garvin's influential essay on the dimensions of quality (1987) he relegates aesthetics and perceived quality as the most subjective aspects of product design, the facets most open to interpretation and therefore least manageable and thus relegated to mere footnotes in the product management literature. The implication of this it would seem, is that "whole product experience" is perhaps relegated to footnote, that the essence of design, is essentially unmanageable, and yet...

Expressing Experiences in Design B. Moggridge Interactions 6 17-25 (1999)
In contrast, Moggridge argues that the essence of design should in fact be the central focus of product design. The term he uses is 'Design Expression', the expression of the design. Design expression suggests the particular manifestation of a design. It is a holistic concept. The notion of 'expression' draws on and supports the language of design, design values such as: tradition, simplicity, elegance, complication, playfulness, youth, childhood, age, skill, strength, transparency etc.

According to Moggridge, design should satisfy many senses, not merely the eyes. Another way of putting this; design can harness many senses to better fulfil the designer's intent.

Since the Moggridge's article, the then rather unconventional examples, have, largely become mainstream products or features. The following products amplify some of these ideas:

Montage of tabletop interface props used in Hawaii Five 0 series (search link)
Usability Evaluation Considered Harmful (Some of the Time) S. Greenberg and B. Buxton 111-120 (2008)
All well and good then, but what is the essence of design? A finished product? No. Greenberg & Buxton (2008) contend that design is processual, a process that should remain rather open-ended as long as possible to explore, learn from and respond to that learning. Sketching is a crucial stage in HCI (human computer interface) designing. But they caution against making design appear too polished, that there is value in presenting it in rough form, as contingent and open ended, in order to facilitate learning (from the field, from users, etc). They caution against using high fidelity prototypes too soon.
The problem is that these working interactive sketches – especially when their representation conveys a degree of refinement beyond their intended purpose – are often mistaken for prototypes, i.e., an approximation of a finished product. Indeed, the HCI literature rarely talks about working systems as a sketch, and instead elevates them to low / medium / high fidelity prototyping status, which people perceive as increasingly suggestive of the finished product. Yet this perception may be inappropriate, for prototypes are very different in purpose from a sketch. 

Monday, 7 September 2015

What customers really want?

How do you decide what product feature to develop next, how to enter new markets, address more customers, how to disrupt and innovate with your product?
  • Innovation is hard.
  • Innovation is not simply a matter of inventing new stuff.
  • But yes, innovation is all about the introduction of the new.
  • Introduction implies dialogue, talking with and listening to.
  • Innovation holds out the promise of growth and transformation, both of which are difficult to predict based on historical data.
What customers really want is something for a "job to be done". Think of this in terms of what the customer comes into your shop to buy.  Think of it as your customer having 'a goal in mind' and your product or service is simply an 'in order to...' But sometimes the product you deliver is like an infrastructure or background against which the customer does something.
SnapChat is a bit like this (as are email, FaceBook etc). The service offers some way that lets the customer do something; send a message, post a photo, annotate or draw on a photo, share the picture with friends.
Think of your product and features in this way. No one buys a phone for the pleasure of owning a phone, they own it in order to call and receive calls. At a very basic level your product or service is simply an 'in order to..', it is necessary equipment for the 'job to be done.' This basic level of utility merely gives your product permission to be considered for use. 

http://blogs.hbr.org/2014/05/generating-data-on-what-customers-really-want/
also
(http://www.ie.edu/business-school/faculty-research/faculty/juan-pablo-vazquez?_adptlocale=en_US)

Juan Pablo Vazquez Sampere offers the following diagnostic in order to address this problem, of finding out what customers really want.
  1. List what you think are the 10 key characteristics of your product offering (e.g. speed, easy to use, ergonomic, cheaper than rivals, etc.)
  2. Then interview 10 users and 10 non-users of your product, but importantly ask them questions that seek to understand their "job to be done" and "in order to's'.
For users start by asking:
"
a) Where are you when you are using this feature?
b) When you use this feature, what are you really trying to do? (accomplish, achieve...)
c) If this feature were not available, what would you be using instead?
You can ask the second two questions without reference to your product.
(Sampere, 2014)"
Likewise as non-users the second two questions without reference to product, they don't use it anyway but they still attempt to achieve "in order to's" or complete "jobs to be done". Vazquez's steps 3, 4 5 & 6 are methodological: 3 - Transcribe the recordings, 4 - code the transcripts, 5 - group codes, 6 - interpret the data (in this article Vazquez recommends quantitative analysis of the coded data). Alternatively I recommend the application of grounded theory to code and interpret this kind of interview based quasi-ethnographic qualitative data. Basically Vazquez has provided a light-weight sketch of an interpretive investigation, how to research the subjective aspects of product use.
The same questions are employed for product design, in particular for discovery and evaluation. These activities may go by different names; requirements engineering, feature design, and testing. They may be embedded within the various documents of a product project plan or design specification. They are however of such fundamental importance to good product design that we really should bring them to the front.
Don Norman's design framework in the Design of Everyday Things (1988) highlights the need for designers to focus on these 'jobs to be done' or 'in order tos'. These are equivalent to the question we ask users; 'what is the goal'? Norman elaborates further on two 'gulfs' between users' intention and what happens in the world. Designs must necessarily overcome these gulfs in order for the user to succeed in their intention. The designed object is the link between a user's goal and the world they are situated in. Execution refers to a designed object's capability to satisfy the user's goal. Evaluation refers to how a designed object responds or signifies state, essentially how feedback is presented to the user. 
Seven questions are posed for designer and user:
"
The goal question:
1. Forming the goal (Q: What do I want to accomplish?)
The gulf of execution involves 'discovery'. Users ask:
2. Forming the intention (Q: What are my alternatives?)
3. Specifying the action (Q: What can I do now?)
4. Executing the action (Q: How do I do it?)
The gulf of evaluation involves feedback. Users ask:
5. Perceiving the state of the world (Q: What happened?)
6. Interpreting the state of the world (Q: What does it mean?)
7. Evaluating the outcome (Q: Is this OK? Have I accomplished my goal?)
"
(p48 DOET and in Instructor Notes on Udacity)
"Good designers empathise with the people that they're designing for" Don Norman. The key concepts that designers employ (according to Norman) are the following:
  • Affordances
  • Signifiers
  • Conceptual model
  • System image
  • Discoverability 
  • Feedback

Sunday, 6 September 2015

Constructing System Descriptions...

There are many methods and tools proffered as system frameworks and aides for the job of gathering information and constructing system descriptions. The following approaches are helpful approaches for describing the more or less complex organisational, inter-organisational, market, and social relationships of technologies and their working contexts.

Organigraphs for Describing Organizations
Organigraphs are a tool for drawing and representing the relationships and activities of an organisation. They are an alternative to organisational charts as a tool for mapping an organisational relationships and interactions.
They can be treated as an antidote in some respects to the traditional organisational chart, instead of the familiar hierarchical view depicting names, titles and formal lines of authority.
“Organigraphs have been able to demonstrate how a place works, depicting critical interactions among people, products, and information. …to stimulate conversations about how best to manage their operations and which strategic options make the most sense,” (Mintzberg and Van der Heyden, 1999)
Organigraphs are a view of the organisation that can be more aligned with its activities and their interrelationships or workflows. Activities and functions could be thought of as the organs and muscles of an organisation. The act of redrawing the system of the organisation in this way offers a lexicon for represent and redefining organisational action. It offers an approach for analysts to elicit and generate “new vocabulary, and associated pictures... [to bring] choices into high relief.” (Mintzberg and Van der Heyden, 1999)

The Organigraph Palette consists of: People, Products, and Information (Figure below). Different actors internal and external to the organisation are included. The boundary of the system is loosely defined; in fact the value of depicting organization in this style is that the boundary can be redrawn and rethought.
Basic Organigraph graphical elements and simple example applied to a newspaper publisher

The ‘ecology’ of the organization, its products and the environment within which they exist can be highlighted. Furthermore these views depicts people (as individuals, teams, or divisions), products (things, services), and information, equally. There are three basic representations; chains, hubs and webs. Typically nodes will be people or products and arcs or connections will be product movement, transformation or information. The following example illustrates the multiple ways we may represent the product development and support function in an IT organization (figure below).
Three different representations of customer interaction with the organisation

There are no ‘right’ organigraphs, just those that are more or less useful. Remember, the different organisational metaphors are simply useful ways of thinking about organisation. As an analytical approach this kind of organisational mapping can draw out and juxtapose the various connections and flows. It highlights sequential, radial and web-like relations. They allow us the opportunity to redesign the relations, or highlight them so they can be better understood and supported. The graph provides a system-like view of the organisation in its environment and the activity focus within the organisation and for actors outside the organisation.

Activity Theory as a System for Describing Systems
Activity Theory has been employed as a descriptive theoretical framework to assist systems development, for eliciting and refining requirements with the goal of developing prototypes through to new technology in live user settings. It was adapted to analyse user situations and needs when cooperative work settings are reconfigured with computer support. It has strong theoretical constructs, an iconic structure, it focuses on the individual within organisations and society, and its primary unit of analysis is activity. Activity Theory includes the actors and objects involved in the process of someone transforming something into something else. This is the key process of development where the new product embodies or signifies new meaning for a wider community of others (e.g. customers, other members of the organisation). The approach has also been drawn on as a theoretical foundation to design methods like Interaction Design and Participatory Design (Moggridge, 2006, Cooper, 2004, Cooper et al., 2007, Kaptelinin and Nardi, 2006). Researchers have also used it to look at organisational interaction specifically in the contexts of seeking to attain new outcomes in the wider environment. As such activity theory can be used when we attempt to manage the development or intervention in mid-range systems, to innovate social, organizational, and technological processes. It provides a conceptual framework for making sense of how organisational actors can or should go about taking action in situations of changing requirements in dynamic market environments.
The generic Activity Theory dimensions for describing resources affecting change in any setting.

HUMAN SYSTEMS
Human behaviour in groups has proved difficult to manage well using classical scientific methods. Human behaviour is intrinsically complex and revisable. Social phenomena , purposeful systems (Ackoff, 1971), are the edge cases for scientific enquiry (Checkland, 1981). Checkland describes four classes of systems: natural, designed physical, designed abstract, and human activity systems. In spite of the elusive and changing character of purposeful human systems there remains much we can do when acting mindfully in settings to develop new technology and systems.

This issue of boundary setting and description dogged early attempts to construct detailed models of physical processes (e.g. in biology, materials, etc) and led to the idea of closed and open systems. ‘Systems thinking’ is presented as a systematic approach to thinking about ‘wholes’ rather than simplified reductions. By thinking holistically ‘systems thinking’ makes explicit the role of the problem describer (not necessarily the problem setter) as both observer and as an agent actively involved in articulating and refining the problem statements. There are, potentially, many relevant aspects of human activity systems that remain unknown or may be ignored based on how the object of concern and its environment are understood. For example, we generally assume that the outputs (products) of an organization are its primary means for acting in its market or operating environment. However there exist multiple other avenues that are often overlooked: welfare effects from corporate profits, political actions in industry and public forums, marketing, word-of-mouth, ethical and wider corporate governance etc.

The challenge for defining and describing product systems when humans are involved is in determining what we should include (and exclude) from analysis, and therefore, what is understood as relevant ! In essence the description of a complex real world system we be inevitably incomplete. Quantitative models of human activity systems become increasingly sensitive to initial conditions and are vulnerable to unknown factors, in large measure due to “the messy richness of ‘biological effects’” (Checkland, 1981). The problem of complexity is compounded in social studies and organizational behaviour because the social environment and its conditions of possibility are themselves social constructions; where a social construction can be understood as an on-going process of participation in collective sense-making (Giddens, 1984). Therefore, in human systems (organisations, markets, culture, society) – the subject matter for management, engineering and social science – working hypotheses, laws and generalities may hold for periods of time, but they remain open to revision and reinvention. The added complexity of social processes in society, markets, and organisations, and associated problems we hope to resolve, may often work against the rationality of scientific or engineered solutions (experimentation, observation, reduction).

REFERENCES

Tuesday, 6 November 2012

Are there organisational archetypes for high-tech firms?

Alex reminded me of this funny take on organisational charts emphasising the influence of the Owner/Founder/CEO in IT companies. Amazon appears as a classical top down hierarchy with no inter-communication among peers. In Google's case its two founders: Larry Page, Sergey Brin,  plus one (Eric Schmidt I presume) appear to be cloned throughout a tiered organisational with multiple lines of communication among all levels. Facebook is presented as a mesh with no layering and isolated local pockets of communication. Microsoft as a network of hierarchies with each subdivision at odds with all of the others. Oracle as a legal firm with a small engineering division attached to it and both divisions reporting directly to Larry Ellison the CEO. And Apple as a blob of individuals, each one under the direct supervision of the then CEO Steve Jobs, suggesting a minimum of delegation.

http://usingapple.com/2011/06/funny-organizational-chart-for-apple-facebook-google-amazon-microsoft-oracle/

Consider relating the ideas behind these depictions to Steve Sawyer's social archetypes of software development teams... The sequential model of task/role separation seeks to address the challenge of control, the group model fulfils the desire for intercommunication where task/role separation is infeasible, and the network model resolves task/role specialisation by establishing responsibilities specific to the production being performed. We might consider the possibility too perhaps that each archetype is a remedy for the problems arising from over dependence on one of the others.

Monday, 7 November 2011

Three software development team archetypes

While it is obvious to say that social engagement is an underlying dynamic in teams, the `obvious' is often ignored or even thought of in terms of a problem that must be overcome. Consider instead if we start from the assumption that team structure arises as a consequence of social relations rather than the other way around. Under these assumptions then, the activity of management (not necessarily the job title) can be seen as the act of fostering the social relations of a team rather than manipulating them.

Sawyer's analysis offers some paradigmatic filters to view and manage systems development, as a diagnostic lens and a tool to intervene.
"The sequential team archetype of software development team social structure draws on the work design tradition in industrial engineering. Work is seen as a set of discrete tasks that can be measured." 
"The group archetype draws its intellectual roots from theories of social psychology, such as 'work redesign'. Work redesign arose in response to such issues as personnel motivation, retention, and productivity that typically occur in a work design approach." 
"The network group archetype draws on concepts of social network theory. In this archetype a group of people is linked by the relative 'strength' of the social ties among them. Work is seen as the use of these links to deliver and receive information; these uses both span and define tasks."
Certainly Sawyer's archetypes are just that, archetypes or caricatures. All teams are hybrids but we easily recognise elements of the archetypes at different times and in our own behaviour. Perhaps a key insight is that our individual personalities and temperaments incline us towards one mode or another, perhaps at different times and regardless of the organisational structures in place. And each archetype invokes a specific remedy (communication can overcome the limitations of silos, groups often need direction and control, networks need opportunities to interact and bottle-necks can be a problem).


Reference
Sawyer, S. (2004) Software development teams. Communications of the ACM, 47, 95 - 99.

Monday, 19 September 2011

Storyboarding ideas

Why should I care about what you've got to say?
Storyboarding is a technique I can use to help craft my message (Reynolds, 2008). Going about the business of presenting ideas has to be seen as a process. It's a creative process that rarely proceeds in linear, sequential fashion from initial concept through to completed work. The problem with software tools like PowerPoint is just that, they are tools, part of my equipment but not the source of my inspiration nor necessarily the subject matter. That said the tools are great aides for producing 'the work' but I need to include all the equipment I'm going to use because it's all part of the process and therefore necessary and relevant: sticky notes, whiteboard, back-of-a-napkin, sheets of paper, and software tools.

Foremost I should know what my message is. In this case, I want to convince others that storyboarding is a great way of structuring a persuasive narrative. I also want to link this to the idea that the media I use is merely an adjunct to the the narrative, even when I capture and distill my story in a close-ended format like film. What I mean is by this is that the narrative still needs me (and you the audience) to interpret it.

Garr Reynolds describes 'crafting the story' as a process, a process that takes place over a number of steps (Reynolds, 2008). I'll use the phrase 'categories' rather than steps. The process of crafting the story starts from a 'core message after which we branch into a mixed sequence of activities that I'll paraphrase from Reynolds as follows:
  • Brainstorming
  • Grouping & identifying the core
  • Layout and organising
  • Dry run and re-organising
Implicit in the process is its iterative, non-linear nature.

Let's look at "The Learner's Journey in Practice" by Brian Sawyer to illustrate the narrative of a story and an approach to structuring it. Sawyer presents a case of storyboarding with a colleague (Michael Milton) to outline the detail of a book chapter. They structure the chapter around a learner's learning process. They start from a basic linear narrative ploy, learning as a journey with a beginning, middle, and end. The learner they envisage needs to cover a number of major points and the major points are interspersed with supporting subtopics. They then create a scenario, a "learner's journey", to overlay the storyline. Sawyer then uses the idea of an actual reader undergoing his or her own learning experience; feeling the peaks and troughs of accomplishment, the 'oh crap' valleys and the 'I rule' moments. The scenario becomes a narrative tool to refine the chapter content, order, and presentation.

Sawyer's linear story is just one way of depicting what Reynolds calls layout. But how does the scenario work? The story is the simple linear sequence but the narrative is what they construct around the bare facts of the story. The narrative sketches how someone (a generic audience) encounters the facts as they are presented or made available 'in order'. Perhaps most important and implied but not explicit is that the rough notes, the storyline and the narrative structure are also necessary tools and technique for communicating ideas these. In the first instance Sawyer might be working alone but still putting ideas down and re-engaging with them, reorganising them. This process of capturing, organising, reorganising is a simple compelling account of what goes into presenting ideas but a lot of work has taken place prior to this stage; the goal of the book, deciding what the chapters should cover, how the chapters relate to each other etc.

RESOURCES
The following tutorials from UCD's School of Information and Library Studies (now titled the UCD iSchool) may be of interest (note that JayCut, the Blackboard Wiki, and other systems they describe are no longer available).


Footnote:
Storyboard techniques for software projects

REFERENCES
Reynolds, G. (2008) Presentation Zen: Simple Ideas on Presentation Design and Delivery, Berkeley, CA, New Riders.
Sawyer, B. (2009) The Learner's Journey in Practice. (blogs.oreilly.com)